Keep the source intact.
Retain the original export so every included or rejected row can be traced back to its input.
WORKING SAMPLE · EXCEL + PYTHON
See how inconsistent service data becomes a weekly workload and SLA report, with questionable records held for review.
Demonstration using fictional data. These figures are sample outputs, not client results.
The workbook and finished report can be viewed without Python. The full package includes the script, source CSV, exception list, and instructions.
Retain the original export so every included or rejected row can be traced back to its input.
Normalize team names and IDs. Flag duplicates, missing values, invalid dates, and negative hours.
Calculate workload and SLA performance from eligible records. Correct the source and see the workbook update.
INSIDE THE DEMONSTRATION
The sample holds 10 questionable records for review and reports on the remaining 87. Both copies of a duplicate ticket are held, so repeated rows cannot inflate the totals.
SLA: resolution hours are less than or equal to the ticket’s target hours. All performance metrics exclude records needing review.
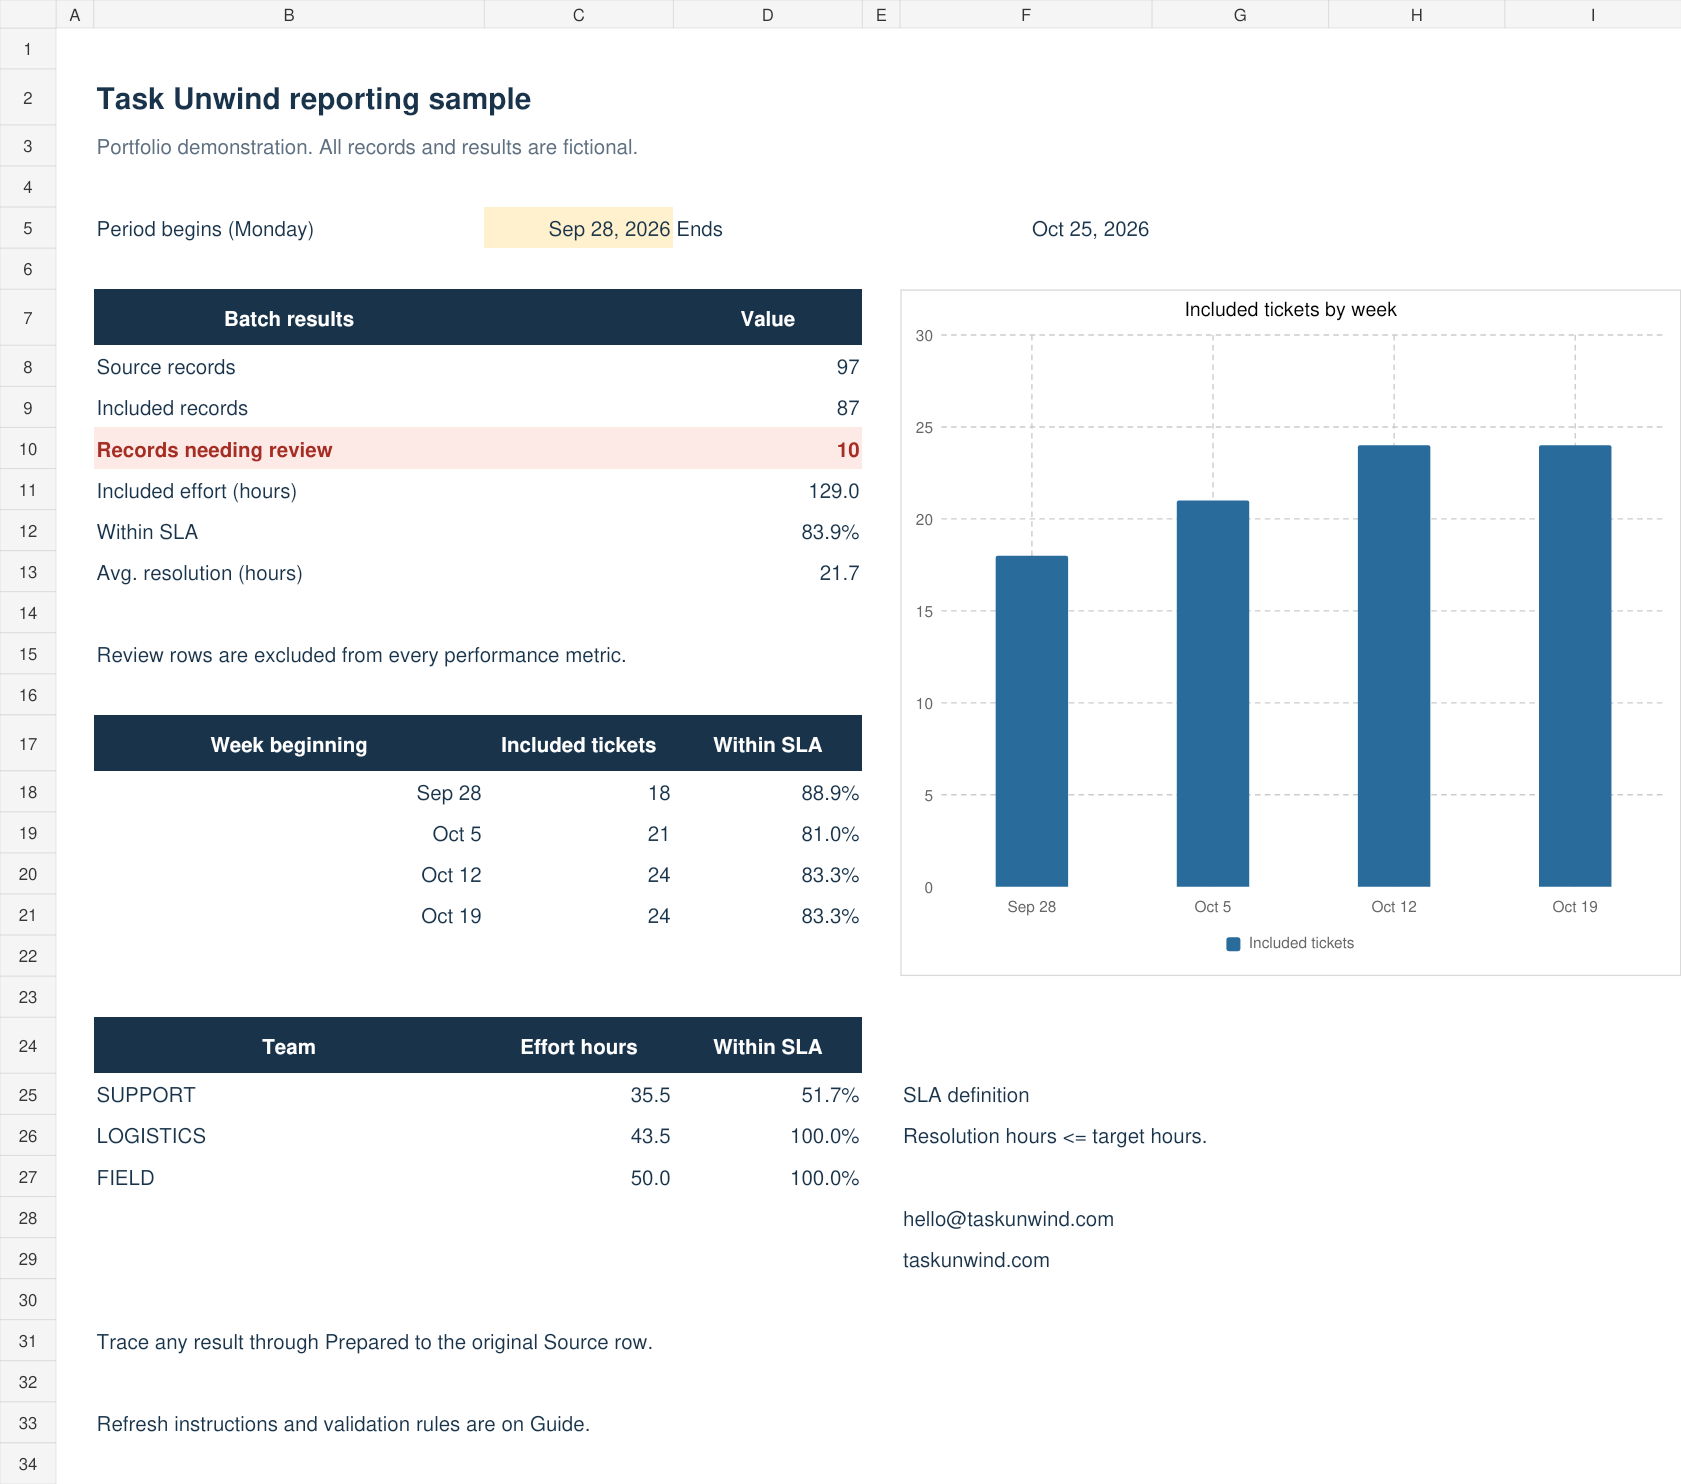
The Excel sample supports a 28-day reporting window and up to 206 input records. Paste replacement data into the existing Source area. The Python option reads a CSV and generates a separate HTML report and CSV outputs.
Workbook calculations were checked against an independent calculation and the Python output. Tests covered record additions, zero versus blank effort, duplicate IDs, SLA equality, and reporting-date boundaries. The workbook has not been tested in desktop Microsoft Excel.
This demonstration was built with AI assistance. It includes no employer data, macros, scheduled runs, source-system connections, or automatic email delivery.
Describe your exports, review steps, and weekly effort. Get a practical assessment of what is worth automating.